Documentation Index
Fetch the complete documentation index at: https://nixtla-docs-broken-links-fix.mintlify.app/llms.txt
Use this file to discover all available pages before exploring further.
TimeGPT is a production-ready generative pretrained transformer for time series. It can accurately predict domains such as retail, electricity, finance, and IoT with just a few lines of code. Get started below!
Implementation Guide
Create a TimeGPT account and generate your API key
• Visit dashboard.nixtla.io to activate your free trial and create an account.
• Sign in using Google, GitHub, or your email.
• Navigate to API Keys in the menu and select Create New API Key.
• Your new API key will appear on the screen. Copy this key using the button on the right.
• Sign in using Google, GitHub, or your email.
• Navigate to API Keys in the menu and select Create New API Key.
• Your new API key will appear on the screen. Copy this key using the button on the right.
Import the Nixtla TimeGPT client
Import the Nixtla client and instantiate it with your API key:Verify the status and validity of your API key:
Nixtla Client Setup
Validate API Key
API Validation Output
API Validation Output
Validation Log Output
Important: For enhanced security practices, see our guide on
Setting Up your API Key.
Start making forecasts!
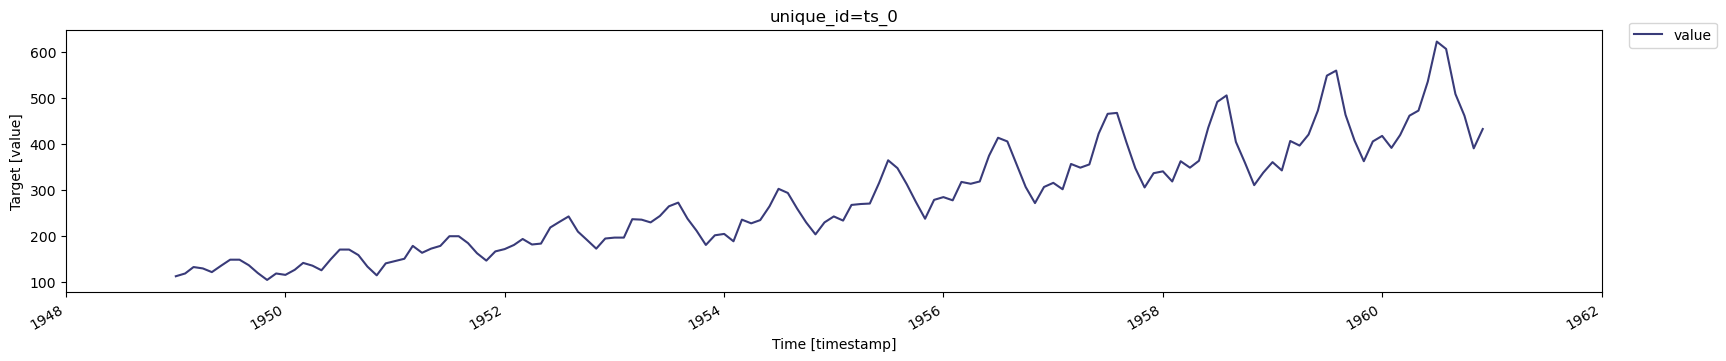
1. Load the AirPassengers Dataset
We will use the classic
AirPassengers dataset to demonstrate forecasts.2. Preview the Dataset
Quickly examine structures like timestamps and values before forecasting.
3. Plot the Time Series
Visualize historical data to understand trends or seasonality.
Load AirPassengers Data
| timestamp | value | |
|---|---|---|
| 0 | 1949-01-01 | 112 |
| 1 | 1949-02-01 | 118 |
| 2 | 1949-03-01 | 132 |
| 3 | 1949-04-01 | 129 |
| 4 | 1949-05-01 | 121 |
Plot AirPassengers Data
Data Requirements
Data Requirements
- The target variable must not contain missing or non-numeric values.
- Date stamps must form a continuous sequence without gaps for the selected frequency.
- Pandas should correctly parse the timestamp column (see Pandas documentation).
- The forecast method does not fill or handle missing dates.
Saving Figures from TimeGPT
Saving Figures from TimeGPT
The
plot method automatically displays figures in notebook environments. To save a plot locally:Save Figure Example
Short and Long-Term Forecasting Examples
Generate a longer-term forecast
Generate a longer-term forecast
Forecast the next 12 months using the SDK’s Display the forecast: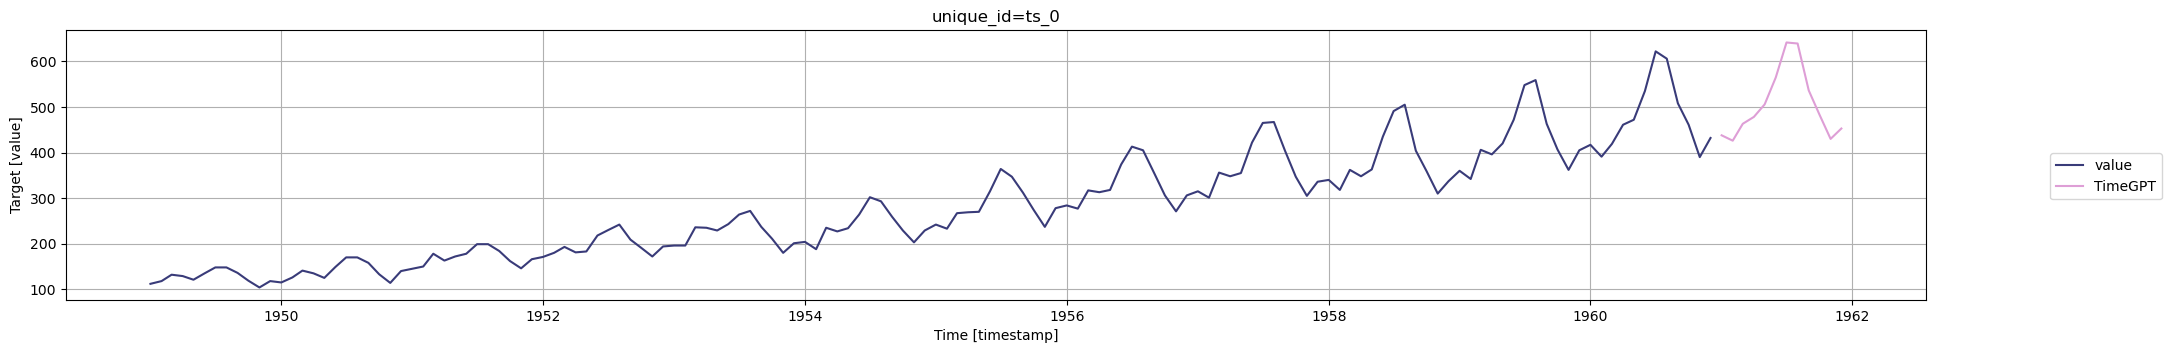 You may also generate forecasts for longer horizons with the
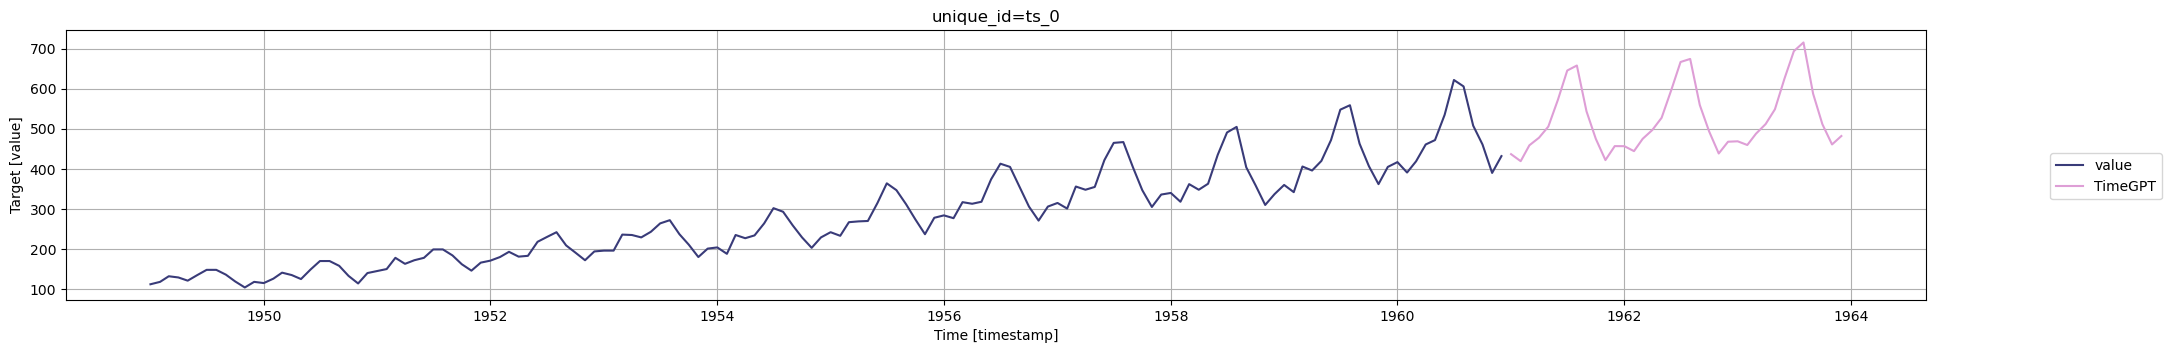
forecast method:Forecast 12 Months
Plot 12 Month Forecast
timegpt-1-long-horizon model. For example, 36 months ahead:Forecast 36 Months Long Horizon
Plot 36 Month Forecast
Generate a shorter-term forecast
Generate a shorter-term forecast
Forecast the next 6 months with a single command: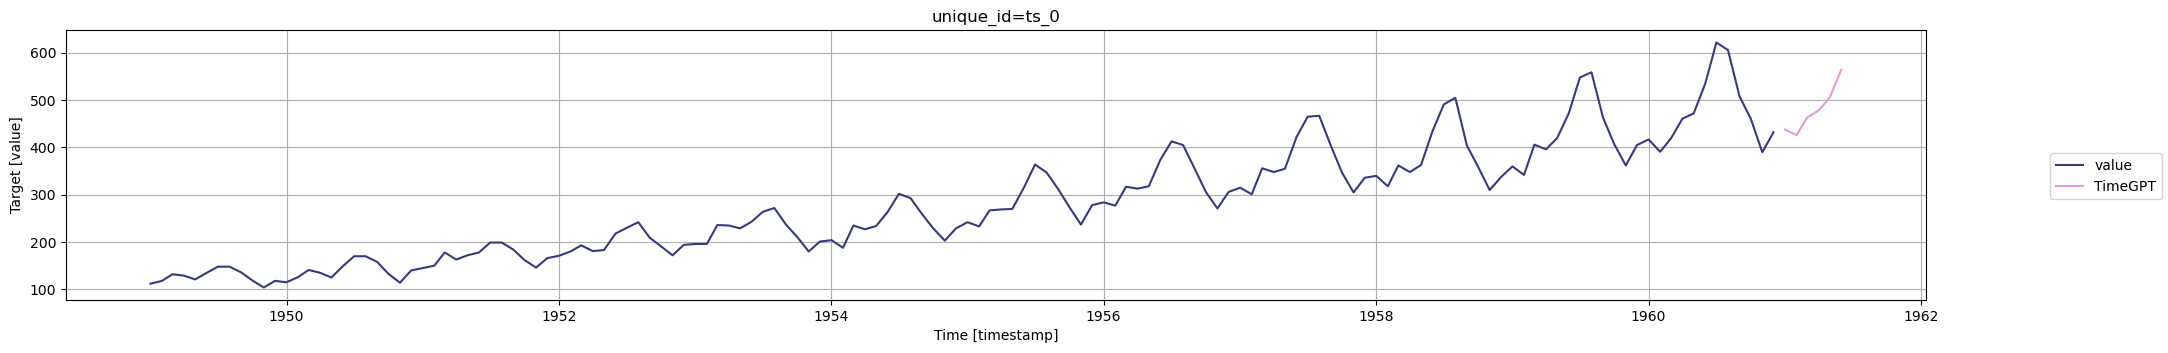
Forecast 6 Months